
See Ya There / Annual report
The State of Happy Hour 2026
A data-driven look at where America unwinds, and the restaurants, bars and neighborhoods that make it happen.

139,362
restaurants with a working website in 22 metro areas
16.3%
of restaurants with a working website post a happy hour
3–6pm
is the most common happy hour window
Denver, CO
27.1%
of restaurants with a website post a happy hour
01 / The big picture
America has a happy hour habit.
From coast to coast, happy hour is more than a deal. It’s a ritual. In 2026, 16.3% of restaurants with a working website advertise a happy hour, and in Denver, CO it’s 27.1%.
See more insights
16.3%
of restaurants advertise a happy hour
3–6pm
most common happy hour window
44.5%
of happy hour restaurants run one on a weekend day
02 / The rankings
Who’s winning happy hour?
Share of restaurants with a website that post a happy hour. Nationwide: 16.3%.
- 01Denver, CO27.1%
- 02Phoenix, AZ26.3%
- 03Austin, TX25.1%
- 04Minneapolis, MN24.2%
- 05Miami, FL22.0%
- 06Omaha, NE21.3%
- 07San Diego, CA21.0%
- 08Seattle, WA20.1%
- 09Dallas, TX19.9%
- 10Washington, DC19.8%
- 11Houston, TX19.2%
#1
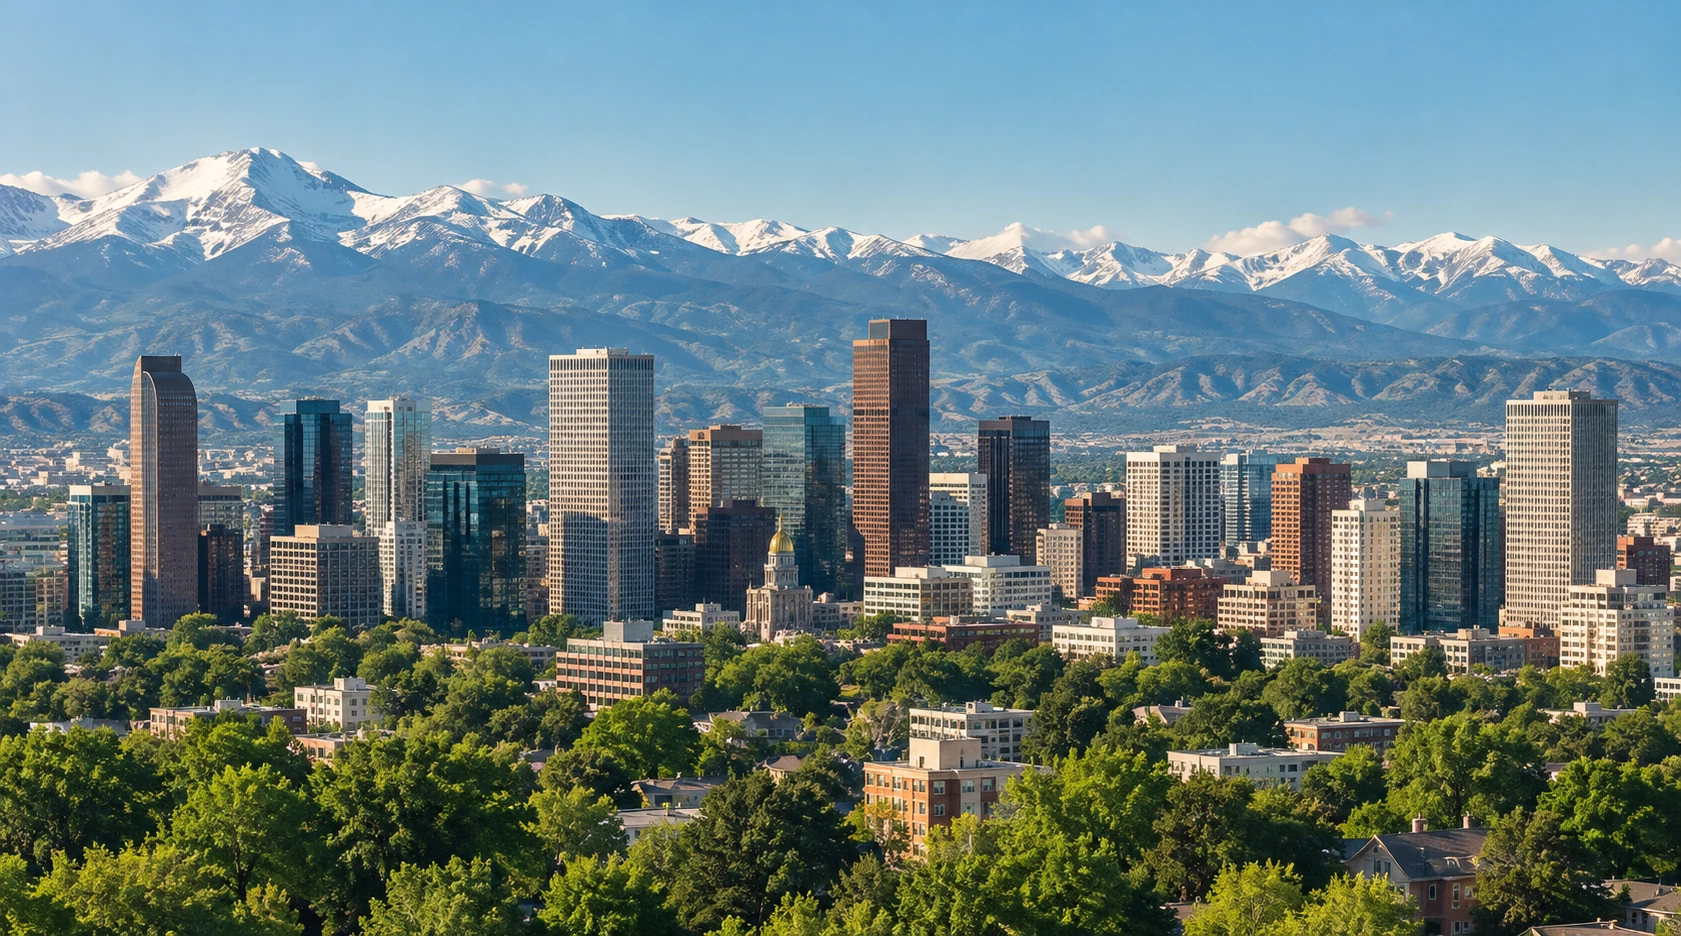
Denver, CO
America’s Happy Hour Capital
27.1% of restaurants with a website in Denver, CO post a happy hour, the highest of any metro we analyzed.
In Denver, happy hour isn’t just a deal. It’s a way of life.
Explore Denver03 / When America goes out
The 3–6pm phenomenon.
Across all 22 metros, 3–6pm is the most common happy hour window. But every city has its own rhythm, from early birds to night owls.
See every metro’s start timeShare of restaurants with a timed happy hour, by the hour its earliest weekly happy hour starts.
04
Every metro
Each metro’s place in the ranking and where it stands out. The full numbers are in the table below.
1of 22
Denver, CO
2nd for restaurants with deals
3,869restaurants with a website
45.4%deal rate
3pmmost common start (46.9%)
Happy hours in Denver, CO27.1%happy hour rate
2of 22
Phoenix, AZ
1st for restaurants with deals
4,269restaurants with a website
47.3%deal rate
3pmmost common start (52.4%)
Happy hours in Phoenix, AZ26.3%happy hour rate
3of 22
Austin, TX
4th for late-night happy hours
3,288restaurants with a website
43.3%deal rate
3pmmost common start (48.6%)
Happy hours in Austin, TX25.1%happy hour rate
4of 22
Minneapolis, MN
2nd for late-night happy hours
3,586restaurants with a website
43.6%deal rate
3pmmost common start (46.2%)
Happy hours in Minneapolis, MN24.2%happy hour rate
5of 22
Miami, FL
1st for lunch specials
6,754restaurants with a website
45.2%deal rate
3pmmost common start (33.1%)
Happy hours in Miami, FL22.0%happy hour rate
6of 22
Omaha, NE
2nd for weekend happy hours
1,175restaurants with a website
43.2%deal rate
3pmmost common start (50.5%)
Happy hours in Omaha, NE21.3%happy hour rate
7of 22
San Diego, CA
4th for happy hours that start together
4,384restaurants with a website
38.2%deal rate
3pmmost common start (48.7%)
Happy hours in San Diego, CA21.0%happy hour rate
8of 22
Seattle, WA
1st for most days of happy hour
5,085restaurants with a website
34.8%deal rate
3pmmost common start (46.4%)
Happy hours in Seattle, WA20.1%happy hour rate
9of 22
Dallas, TX
2nd for longest happy hours
8,298restaurants with a website
43.5%deal rate
3pmmost common start (47.6%)
Happy hours in Dallas, TX19.9%happy hour rate
10of 22
Washington, DC
Best showing: 6th for lunch specials
7,449restaurants with a website
42.2%deal rate
3pmmost common start (44.6%)
Happy hours in Washington, DC19.8%happy hour rate
11of 22
Houston, TX
1st for longest happy hours
7,236restaurants with a website
41.5%deal rate
3pmmost common start (48.0%)
Happy hours in Houston, TX19.2%happy hour rate
12of 22
Tampa, FL
3rd for longest happy hours
3,570restaurants with a website
42.4%deal rate
3pmmost common start (41.6%)
Happy hours in Tampa, FL17.6%happy hour rate
13of 22
Orlando, FL
2nd for lunch specials
3,167restaurants with a website
43.3%deal rate
3pmmost common start (45.0%)
Happy hours in Orlando, FL16.6%happy hour rate
14of 22
Philadelphia, PA
3rd for late-night happy hours
7,141restaurants with a website
39.2%deal rate
4pmmost common start (41.2%)
Happy hours in Philadelphia, PA15.6%happy hour rate
15of 22
Los Angeles, CA
Best showing: 8th for late-night happy hours
15,169restaurants with a website
29.1%deal rate
3pmmost common start (46.5%)
Happy hours in Los Angeles, CA13.7%happy hour rate
16of 22
Detroit, MI
Best showing: 7th for happy hours that start together
4,347restaurants with a website
41.1%deal rate
3pmmost common start (47.7%)
Happy hours in Detroit, MI13.6%happy hour rate
17of 22
New York, NY
5th for longest happy hours
25,074restaurants with a website
37.5%deal rate
3pmmost common start (32.4%)
Happy hours in New York, NY13.5%happy hour rate
18of 22
Riverside, CA
2nd for happy hours that start together
3,893restaurants with a website
33.6%deal rate
3pmmost common start (50.6%)
Happy hours in Riverside, CA13.5%happy hour rate
19of 22
San Francisco, CA
Best showing: 13th for weekend happy hours
7,193restaurants with a website
28.9%deal rate
3pmmost common start (41.7%)
Happy hours in San Francisco, CA13.1%happy hour rate
20of 22
Atlanta, GA
Best showing: 9th for lunch specials
6,456restaurants with a website
36.1%deal rate
3pmmost common start (38.3%)
Happy hours in Atlanta, GA8.7%happy hour rate
21of 22
Charlotte, NC
3rd for lunch specials
2,701restaurants with a website
41.6%deal rate
4pmmost common start (40.0%)
Happy hours in Charlotte, NC7.0%happy hour rate
22of 22
Boston, MA
Best showing: 11th for weekend happy hours
6,685restaurants with a website
29.4%deal rate
3pmmost common start (45.2%)
Happy hours in Boston, MA4.8%happy hour rate
05
All the numbers
Every metro, every measure, ranked by happy hour rate. Rates are shares of restaurants with a working website, except the website rate, which is a share of all restaurants whose website we have checked.
22
metros compared
From across the U.S., based on 139,362 restaurant websites.
3pm
leads in 20 of 22 metros
3pm is the most common happy hour start time: 42.8% of restaurants with a timed happy hour start then.
27.1%
is the highest happy hour rate
Denver, CO leads with 27.1% of restaurants with a website posting a happy hour.
| Rank | Metro | With a website | Website rate | Happy hour rate | Deal rate | Most common start | Average length | Days a week | Late-night share | Weekend share | Lunch special rate |
|---|---|---|---|---|---|---|---|---|---|---|---|
| 1 | Denver, CO | 3,869 | 47.1% | 27.1% | 45.4% | 3pm | 3 hours | 5.5 days | 5.1% | 51.5% | 14.1% |
| 2 | Phoenix, AZ | 4,269 | 44.6% | 26.3% | 47.3% | 3pm | 3.4 hours | 5.7 days | 3.8% | 53.2% | 18.7% |
| 3 | Austin, TX | 3,288 | 41.3% | 25.1% | 43.3% | 3pm | 3.1 hours | 5.3 days | 6.1% | 42.6% | 13.9% |
| 4 | Minneapolis, MN | 3,586 | 51.9% | 24.2% | 43.6% | 3pm | 3.2 hours | 5.6 days | 8.8% | 55.1% | 17.6% |
| 5 | Miami, FL | 6,754 | 35.8% | 22.0% | 45.2% | 3pm | 3.3 hours | 5.5 days | 2.5% | 47.8% | 20.9% |
| 6 | Omaha, NE | 1,175 | 54.8% | 21.3% | 43.2% | 3pm | 3.4 hours | 5.7 days | 6.1% | 56.5% | 14.1% |
| 7 | San Diego, CA | 4,384 | 47.8% | 21.0% | 38.2% | 3pm | 2.9 hours | 5.4 days | 3.9% | 50.1% | 10.7% |
| 8 | Seattle, WA | 5,085 | 54.4% | 20.1% | 34.8% | 3pm | 2.8 hours | 5.8 days | 9.2% | 66.5% | 12.3% |
| 9 | Dallas, TX | 8,298 | 42.0% | 19.9% | 43.5% | 3pm | 3.6 hours | 5.2 days | 5.0% | 36.0% | 17.3% |
| 10 | Washington, DC | 7,449 | 47.7% | 19.8% | 42.2% | 3pm | 3.1 hours | 5.3 days | 2.8% | 37.8% | 18.3% |
| 11 | Houston, TX | 7,236 | 40.0% | 19.2% | 41.5% | 3pm | 3.7 hours | 5.1 days | 5.4% | 34.1% | 17.8% |
| 12 | Tampa, FL | 3,570 | 39.9% | 17.6% | 42.4% | 3pm | 3.4 hours | 5.5 days | 3.6% | 47.0% | 16.6% |
| 13 | Orlando, FL | 3,167 | 37.1% | 16.6% | 43.3% | 3pm | 3.3 hours | 5.4 days | 5.0% | 43.2% | 20.7% |
| 14 | Philadelphia, PA | 7,141 | 41.9% | 15.6% | 39.2% | 4pm | 2.6 hours | 5.2 days | 7.0% | 39.6% | 17.3% |
| 15 | Los Angeles, CA | 15,169 | 42.0% | 13.7% | 29.1% | 3pm | 3.1 hours | 5.4 days | 5.0% | 45.9% | 11.3% |
| 16 | Detroit, MI | 4,347 | 45.3% | 13.6% | 41.1% | 3pm | 3 hours | 5.1 days | 3.6% | 35.0% | 16.8% |
| 17 | New York, NY | 25,074 | 38.6% | 13.5% | 37.5% | 3pm | 3.4 hours | 5.3 days | 3.0% | 40.3% | 18.5% |
| 18 | Riverside, CA | 3,893 | 42.9% | 13.5% | 33.6% | 3pm | 3.3 hours | 5.5 days | 3.4% | 52.3% | 11.7% |
| 19 | San Francisco, CA | 7,193 | 45.4% | 13.1% | 28.9% | 3pm | 2.6 hours | 5.1 days | 2.7% | 42.7% | 10.3% |
| 20 | Atlanta, GA | 6,456 | 40.7% | 8.7% | 36.1% | 3pm | 2.8 hours | 5.3 days | 1.8% | 41.5% | 17.5% |
| 21 | Charlotte, NC | 2,701 | 42.7% | 7.0% | 41.6% | 4pm | 2.7 hours | 5.1 days | 1.3% | 35.8% | 20.1% |
| 22 | Boston, MA | 6,685 | 51.2% | 4.8% | 29.4% | 3pm | 2.9 hours | 5.2 days | 2.4% | 44.1% | 13.9% |
All 22 metros, ranked by happy hour rate.
Our approach
Methodology
The State of Happy Hour 2026 is based on See Ya There’s read of 139,362 restaurant websites across 22 metro areas, with data as of October 15, 2026.
See Ya There reads each restaurant’s own website and records the happy hours and specials it posts. Our goal is to provide a consistent, comparable view across major metro areas so we can understand how happy hour is evolving nationwide.
- 139,362
- restaurant websites analyzed
- 22
- major metro areas across the U.S.
How we measured it
We followed a consistent process across all 22 metro areas to find, read, and categorize happy hour information from restaurant websites.
- 01
Find restaurant websites
We identify restaurants with a working website in each metro area.
- 02
Read and extract details
We scan each restaurant’s website for happy hour and specials information.
- 03
Standardize and categorize
We normalize the data into consistent categories (times, $ deals, days, etc.).
- 04
Analyze and rank
We calculate rates and other measures for each metro area and rank the results.
More about our methodology
Which restaurants are included?
Rankings include only metro areas where we scanned at least 150 restaurants, have read the restaurants of at least 95% of the metro’s ZIP codes, and have finished checking the websites of at least 80% of its restaurants that list one. Of 387 metro areas, 22 met these criteria. Metros that did not are left out rather than ranked on partial results.
Metro areas follow the Census Bureau’s core-based statistical areas, and a restaurant in a ZIP code shared by two metros counts in both; national figures count each restaurant once.
How we identify happy hours and specials
A happy hour is an offer a restaurant’s website presents as a happy hour. A special is any other recurring deal it posts: daily, lunch or dinner specials.
A restaurant has a working website when we reached its own site: we read it, or it is there but we could not read it (a bot check, a robots.txt rule, a menu in an image). A listed website that is gone, parked, another business’s or without the restaurant’s location does not count, nor does a restaurant with no website listed.
Key definitions and metrics
Every ranking uses rates and averages, never totals, so cities of different sizes compare fairly. The website rate is the share of restaurants with a working website, among those whose website we have finished checking. Every other rate is a share of the restaurants with a working website.
- The most common start is the start time the most restaurants share, counting each restaurant’s earliest weekly happy hour with clock times (ties go to the earlier time); start agreement is the share starting then, which orders metros that share the same time. Average length uses the same window. Happy hours without clock times (all day, or tied to opening or closing time) are not in either, and a window that passes midnight runs to its end.
- Days a week is the average number of days on which a restaurant with a weekly happy hour runs one, however many items it lists.
- Late-night happy hours start at or after 8pm, counted across distinct happy hour windows.
- Weekend share is the share of restaurants with a happy hour that run one on a Saturday or Sunday.
Data limitations
- A figure based on fewer than 30 restaurants is not reported or ranked.
- A restaurant whose website lists no deals, or that we could not read, counts as posting none.
- Metro areas that did not meet the criteria above are left out, so the 22 metros here are not a sample of every city.
In the news
For press
Reporters are welcome to cite and quote this report with a link to this page. For more data on your city, a different cut of the numbers, or an interview, email us directly. Each metro has its own link, such as /state-of-happy-hour#denver-co, so a local story can point straight to its city.
Suggested citation
State of Happy Hour 2026, See Ya There, https://www.seeyathere.com/state-of-happy-hour